


Q3 22 Sprouts Farmers Market - Mexican Investor
Getting into Q3 KPIs.

In the previous post (and in one of my last tweets) I commented that the Q3 results of Sprouts SFM 0.00%↑ let us see that the strategic plan implemented a few years ago is already bearing fruit, but explaining it on Twitter was somewhat complicated due to the character limit, so I decided to dedicate an entire post to talk about those Key Performance Indicators (KPI) that gave me clues about what the future of this great company could be.

For those who didn’t read the previous post, let's recap the Q3 results:
Sales of $1.59B (+5.4 YoY) vs $1.58B expected
EBIT of $90.3M (+5.3 YoY) vs $77.4M
EPS of $0.61 (+8.9 YoY) vs $0.51
Surprises in every aspect and nice YoY growth.
Did this happened by luck?
Not at all, and here is the link to my investment thesis written in May, where I mentioned that there could be future improvement in the margins.

Spoiler: The whole secret is in the strategic plan that has been implemented since 2020. So before we move on to the KPIs, let's do a quick review of this plan.
The Strategic Plan
“Win with the target customer”: This point is based on giving Sprouts a specific approach that provokes more loyal and profitable customers for the brand, developing a long-term relationship.
“Refine the brand and advertising”: Closely related to the previous point, they are focused on giving advertising a better look and they’re making better offers for customers that are not just pointless “50% sale” or something like that traditional discounts.

“Update format and expand”: Sprouts redesigned the layout of each store and the way products are organized within it, making them smaller, but the important thing is that by doing this, it is estimated that the costs of opening each store are reduced by 20%.
In this new design, 1/4 of the store is dedicated to private Sprouts label products, which have better margins than other brand products.

“Create advantages in the supply chain”: The idea is that there should be a distribution center less than 500 kilometers (≈300 miles) from each Sprouts store, this would waste less food during the distribution process and costs of transportations are gonna be lower too, making supply chain more effectively and reflecting this in the operating margins.
During 2021 they managed to open two new distribution centers, which would leave about 85% of the stores with a distribution center less than 500 km away.
These are the 4 pillars for sustainable growth over time. Now, let's move on to the KPIs where we can see how these pillars are being reflected in the company's Financial Statements already.
How do «sales» grow?
As we could see, sales were reported with a +0.6% surprise compared to analysts expectations. To understand sales growth there are two variables or KPI to take into account:
Construction of new stores
Like-for-like sales growth (comparable sales)
In both there was data from Q3 that I was very excited about, as they can be catalysts for growth.
Construction of new stores
Sprouts is currently in only 23 of the 50 US states and the goal is to grow the number of new stores by 10% per year. During 2021 there were 374 stores, expecting to open 16 new stores this year (a modest growth of 4%) and about 30 stores for the next year.

Having little geographic presence allows to grow organically via construction of new stores, although there is a little surprise being implemented this year. I am going to show the exact words of the management, extracted from their Conference Call.
We recently completed the implementation of a new real estate tool. This tool does 3 things for us.
Provides Sprouts white space details for each Metropolitan Statistical Area in the country. Based on the tool, we believe our brand can support a total of 1,350 stores in the US, an increase of 970 from where we are today.
Identify the best location for our Sprouts store. This allows our real estate team to be more proactive in finding the best sites.
Provides a more accurate sales forecast for each location, helping us avoid potential underperforming stores.
Now the process of opening new stores will (if all goes well) be more efficient, reducing the time spent searching for the perfect space to build a store and reducing those mistakes of having to close stores because it was misjudged how good was the location.
This should reduce the number of stores closing or attempting to relocate, which would increase the number of net open stores each year. Key to organic growth.
Comparable Sales growth
This is the most important measure within the sector. Comparable sales or sales in the same store, calculates the income generated by the company but adjusting the number of stores open and closed during the period.
Between 2017 and 2021, comparable sales had grown at an average of 1.3%, which is a standard range within retail companies, which generally grow their comparable sales between 0 and 2%.
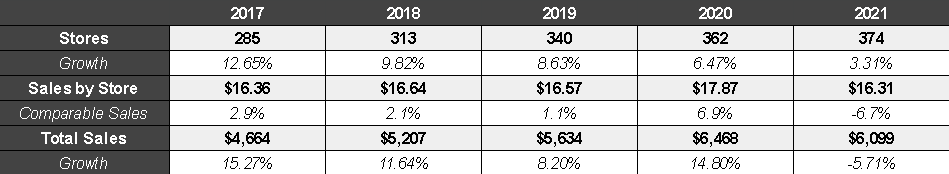
The way to grow comparable sales is by raising prices or by getting customers to bring more products each time they do shopping. The big surprise of the quarter was that comparable sales grew by 2.4%, well above what they had been doing in recent years if we exclude the crazy year that 2020 was.
Question is: What caused this increase in comparable sales?
And again we have the answer in the last Conference Call:
Comparable sales were supported by a basket price increase due to inflation, partially offset by a slight reduction in items per basket.
This shows us that the company has enormous pricing power, since despite the fact that there was notable inflation and the company was determined to pass on all those costs to the final consumer (which is why the shares fell in the previous quarterly report), the consumer continued shopping at the store, even though he/she was forced to reduce the number of items he bought each time he went to the store due to rising prices.
Pricing Power is one of the best competitive advantages, and even more so in an industry where the final consumer does not have the option of simply stop eating to avoid inflation. It is true that they could decide to consume non-organic foods that are normally cheaper, but apparently Sprouts is generating a loyal customer that responds well to a price increase, so it seems that the first point of the strategic plan is going as expected.
So… we can see the moat that the company has, but the interesting thing will be to see the evolution of comparable sales once inflation is reduced to more moderate levels. Still, for a conservative long-term valuation I would consider comparable sales growth of 1 or 1.5%.
How do «margins» improve?
The real eye-catcher of the report was the big surprise in Gross Margin and EBIT versus analyst expectations, so it's key to understand why this +16% surprise versus expectations happened.
Gross Margin
Let's start with the Gross Margin, which during Q3 was 36.7% vs 36.2% during 2021. Given this, the management said the following:
Most of the growth (in Gross Margin) was due to the fact that we did fewer promotions this year than last year when we tried a variety of pricing and promotional tactics.
Remember the second point of the strategic plan? Refine advertising. Well, it is already having direct effects on the margins, since when you improve advertising you can go from making nonsense discounts, to creating offers where you can increase the number of products that a customer takes with each purchase or the price they pay in each basket.
This improves Gross Margins, since the cost of sales is reduced, increasing gross profits. And the important thing is that the management team thinks that these margins are totally sustainable:
Basically, we've changed the business, we've changed the current business, and we don't see gross margins going down from this point.
EBIT Margin
Q3 EBIT Margin was 5.67% vs 5.56% in 2021. A slight increase, the thing is that the market expected the margin to go below 5% due to the effects of inflation on salaries and expenses in the supply chain. Which didn't happen, not even close.
This is the important of the fourth pillar of the strategic plan, since having a better management of the supply chain can bring advantages in the long term, especially in the margins. The tool that I mentioned earlier will also come into play, as less staff will be required.
Valuation with new KPIs
Making an extremely conservative valuation, I will take a store growth of 5% per year. This represents building 15 stores this fiscal year (in line with management expectations) and only 16 by 2023, when the expectation is to build about 30 stores (a 8% growth in the number of stores).
Then, I would expect comparable sales to grow 1% annually after 2022, although we already saw that during this quarter they grew by more than 2% and in fact they expect comparable sales to grow 2% in the full year 2022. Again, following a very conservative assumption.

With these assumptions there would be Total Sales of ∼$8.68B in 2027, which would be a CAGR growth of 6% from 2021 sales.
Taking a FCF Margin of around 5%, a multiple of 15x FCF and 95M shares outstanding, we would have a price per share of almost $68.
Considering that the share price is currently at $33 USD, we could expect a CAGR of ∼15%, that is, doubling your money in 5 years. This seems to me to be an excellent performance considering that it is a stable company and with share prices that are not going to cause you many problems with volatility, with a 0.42 beta.

So, I think that would be all for this post. I am quite excited about the future of this company and I believe that even with recent gains the company could make good returns 5 years ahead, thanks to the fact that it is currently trading at only 14 P/E.
As always, feedback is welcome and I'd like to hear your thoughts on the company.